.png)
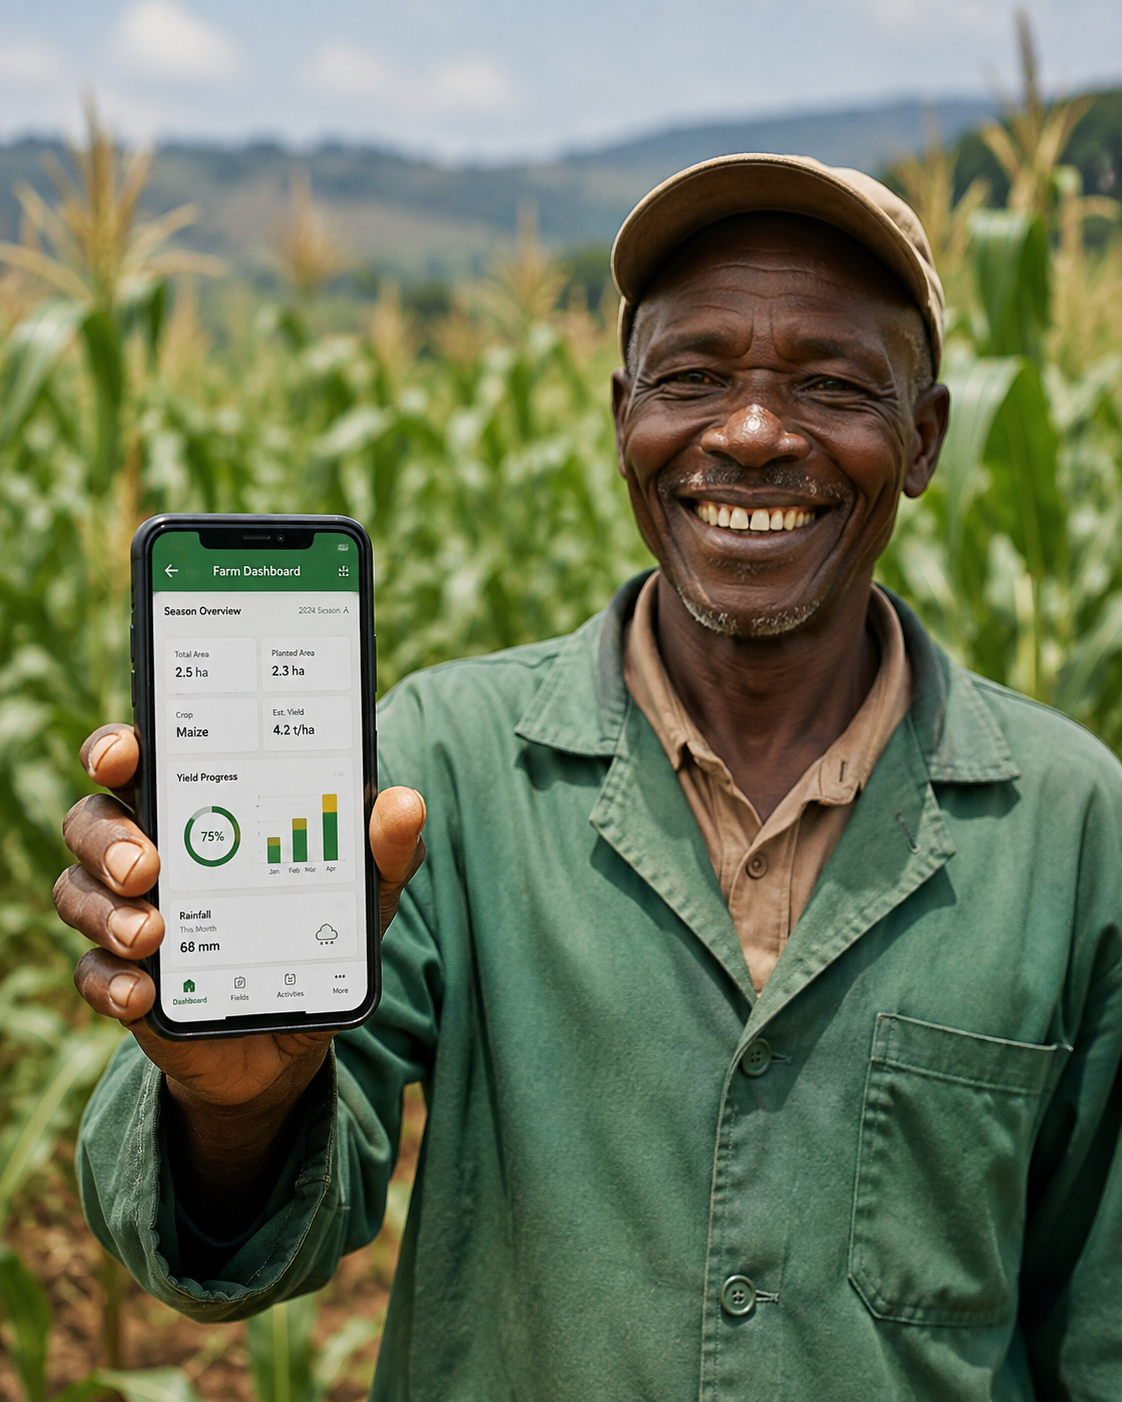

5,000+Farmers using digital tools
Cumulative results across operations
Impact Dashboard
What the figures mean
Progress by Theme
Food & Nutrition
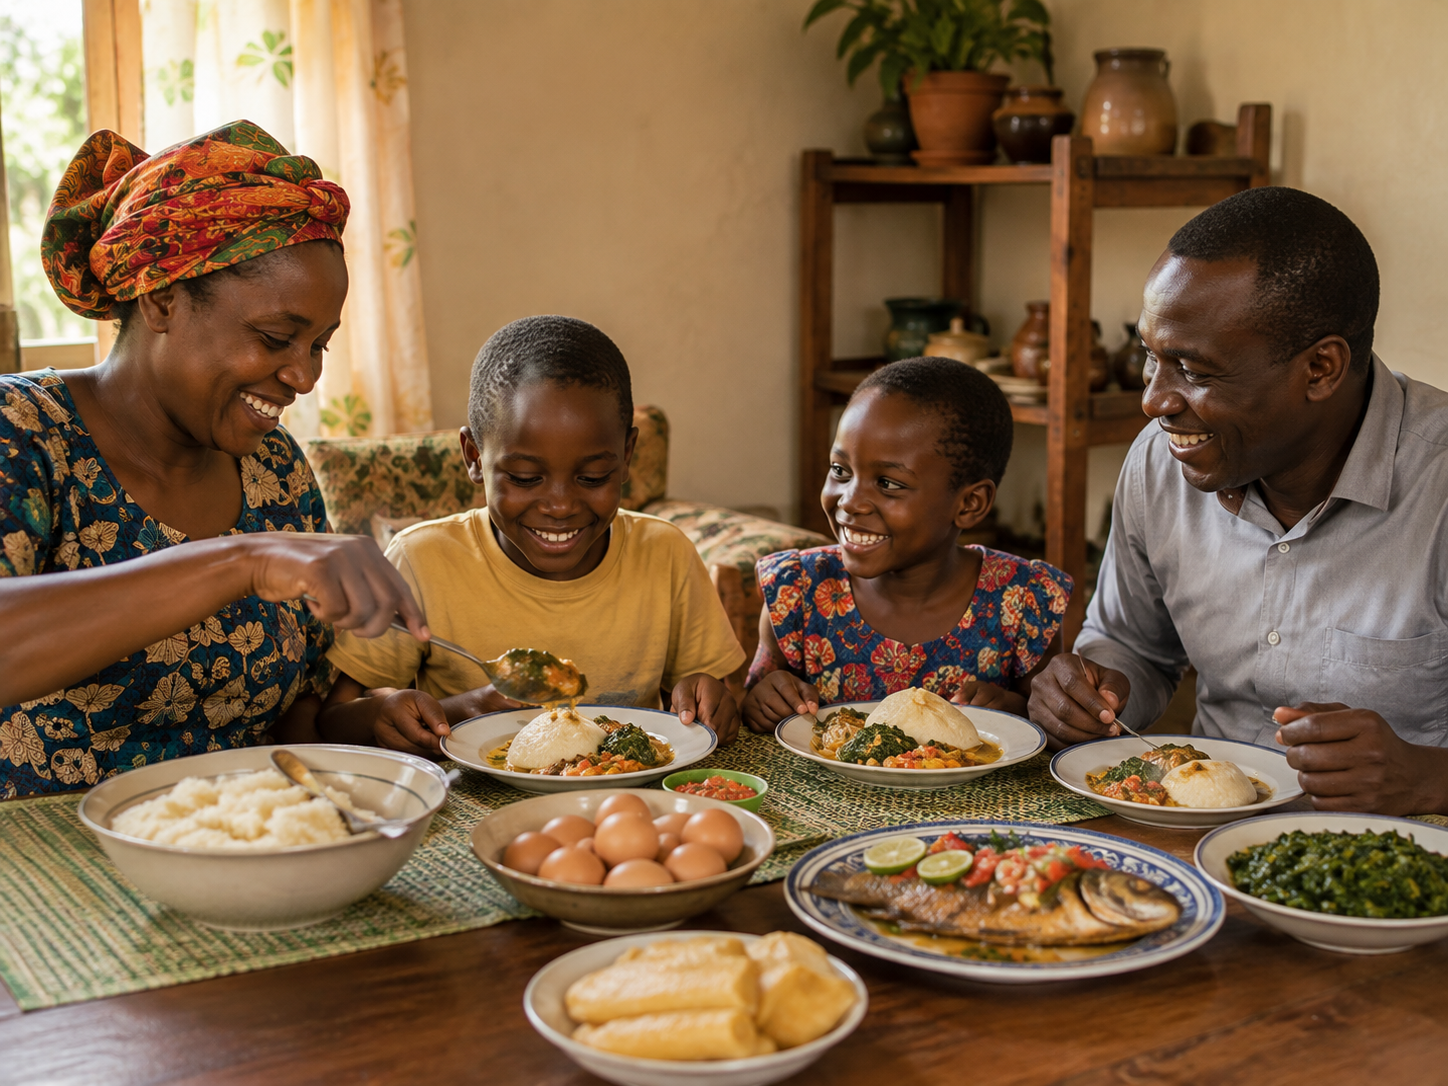
100%Eggs, fish and meat help diversify protein supply. More than 100,000 people have been reached with better nutrition across activities.
Livelihoods & Enterprise
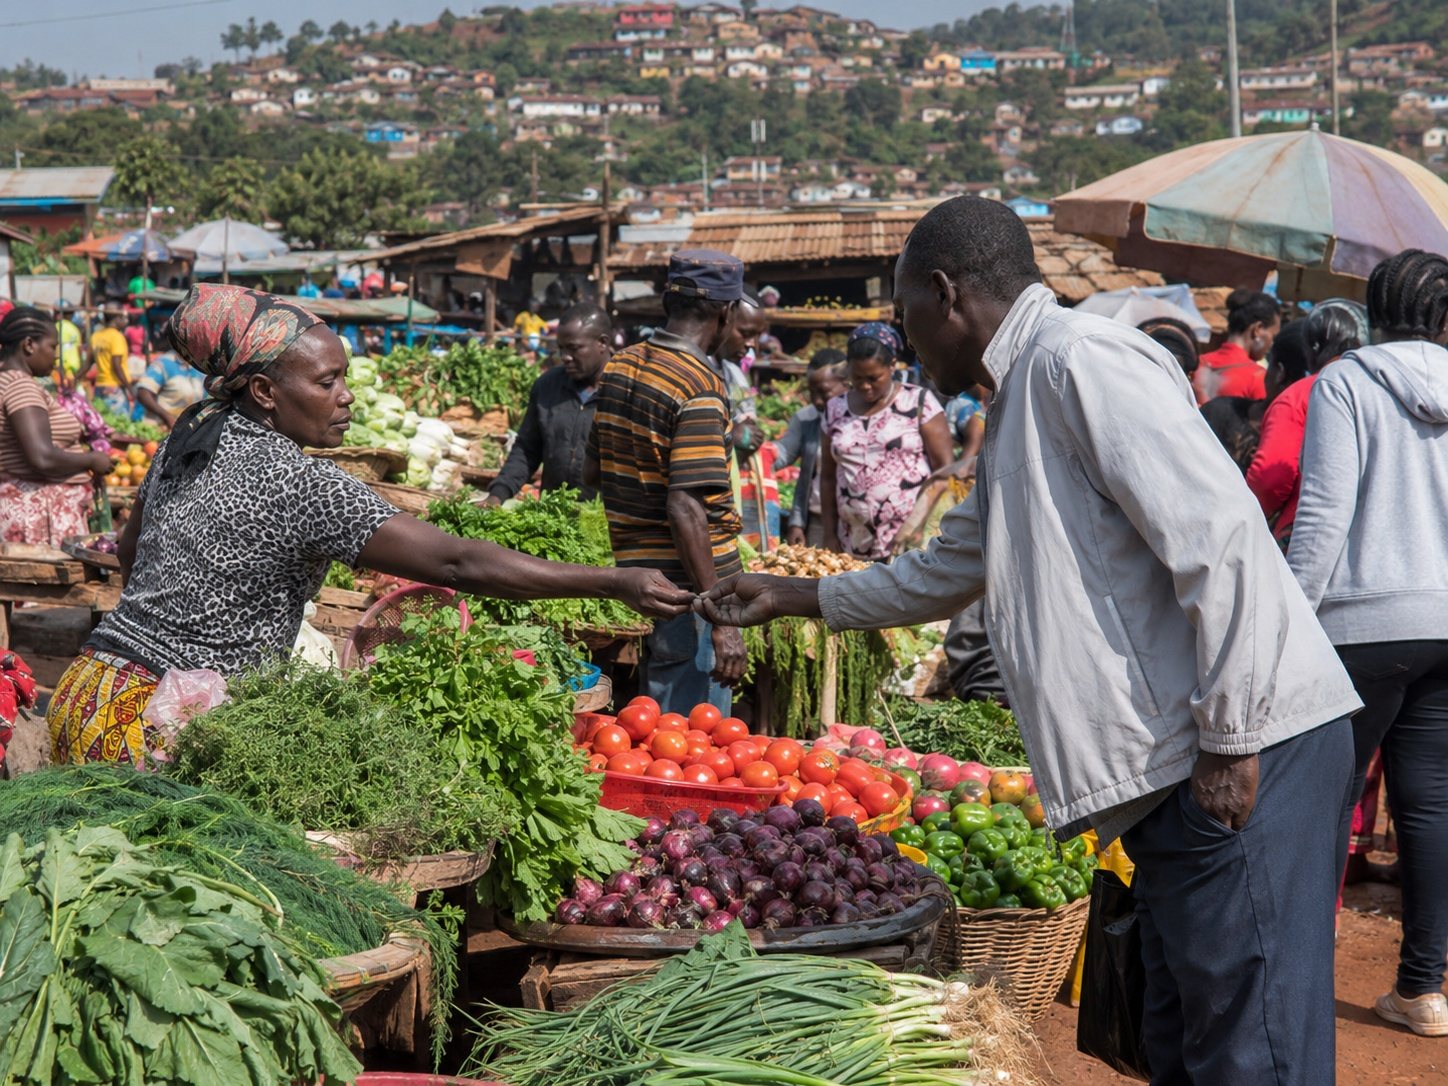
80%More than 10,000 farmers and workers participate, while 80+ enterprises have connected to financial services.
Efficient Production
35%Water-use efficiency has improved by 35% and carbon intensity is 28% lower than the 2022 baseline.
Circular & Compliant
85%85% of waste is diverted from landfill and operations maintain 100% compliance with environmental regulations.
Four SDGs reflected in our work
Aligned With Global Goals
Zero Hunger
Nutritious production and reliable markets strengthen local food availability.
Clean Water
Water monitoring and efficiency protect a critical production resource.
Decent Work
Farm, enterprise and market activity support dignified livelihoods.
Climate Action
Lower carbon intensity and adaptation practices reduce risk.
Methodology note: Figures are cumulative across operations unless described as annual. Production figures are annualised; environmental percentages compare current performance with the stated operational baseline.